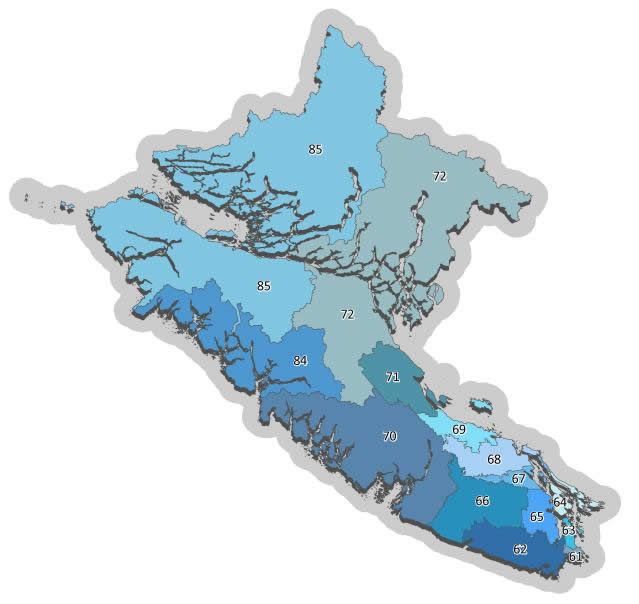
The Island Health region is divided into 14 local health areas (LHAs) – geographic areas defined by the Ministry of Health. Each LHA profile provides information about that area's population, health status and how often health services are used.
For questions, past profiles or if you notice a discrepancy, please contact PopHealthSurvEpi@islandhealth.ca
2025 LHA Profiles
Greater Campbell River LHA Profile
Cowichan Valley South LHA Profile
Southern Gulf Islands LHA Profile
Cowichan Valley West LHA Profile
Cowichan Valley North LHA Profile
Western Communities LHA Profile
Vancouver Island North LHA Profile
Vancouver Island West LHA Profile
For more statistics and information, visit our main Population Health Statistics & Publications page.
About Our Maps
Island Health uses geographical information systems (GIS) to map health statistics. The type of map we use is called a choropleth map.
Choropleth maps display patterns in different areas by shading them different colours. They are widely used in health mapping for a number of reasons:
- The majority of health and demographic data is only released by area.
- By not showing precise locations, these maps avoid concerns about privacy and confidentiality.
Choropleth maps give the impression that each area is uniform, with sharp differences between areas, even though data may change gradually or continuously.
The map’s appearance and the message it conveys varies depending on the size and number of areas mapped, and how they are arranged. For example, small areas are more likely to capture the underlying pattern of health events, while large areas conceal local differences.

